By continuing, you agree to our Terms and Privacy Policy. We'll send important updates on WhatsApp.
1,180+ learners already enrolled
Your next step
Program overview
Tableau is a 45 Days Data Analytics with AI program built around hands-on practice, guided assignments, interview preparation, and placement support. Start with Tableau, practise with Tableau Desktop, Tableau Public, Excel, and connect your learning through applied business scenarios. Build a portfolio that explains your approach and prepare for roles such as Tableau Developer and BI Analyst.
45 Days structured training program
Hands-on practice with Tableau Desktop, Tableau Public, Excel
Live projects and portfolio-ready assignments
Certification guidance and placement assistance
A structured learning journey
Tableau Curriculum
Explore the curriculum, build your understanding one module at a time, and put each new skill into practice.
01Introduction to Data Visualization & TableauModule 1 · 1 topics
Introduction to Data Analytics and Data Visualization Understanding Tableau and its features Tableau Products: Tableau Desktop, Tableau Public, Tableau Server and Tableau Cloud Tableau Interface and Workspace Overview Connecting to Tableau Data Sources
02Connecting to Data SourcesModule 2 · 1 topics
Connecting to Excel, CSV and Text Files Connecting to SQL Databases Working with Multiple Data Sources Live Connection vs Extract Connection Data Source Management
03Data Preparation & Data ManagementModule 3 · 1 topics
Understanding Data Types and Field Properties Data Cleaning and Data Preparation Data Joins and Unions Data Blending Relationships Between Tables Pivoting and Splitting Data
04Tableau FundamentalsModule 4 · 1 topics
Dimensions and Measures Discrete and Continuous Fields Understanding Rows and Columns Marks Card and Show Me Panel Filters, Sorting and Grouping Creating Basic Charts and Visualizations
05Charts & Data VisualizationModule 5 · 1 topics
Bar Charts and Line Charts Pie Charts and Area Charts Scatter Plots and Bubble Charts Heat Maps and Highlight Tables Tree Maps and Packed Bubbles Geographic Maps and Symbol Maps Dual-Axis and Combined Charts
Introduction to Calculated Fields String Functions Number and Date Functions Logical Functions (IF, CASE) Aggregate Functions Type Conversion Functions Conditional Calculations
07Advanced CalculationsModule 7 · 1 topics
Table Calculations Quick Table Calculations Level of Detail (LOD) Expressions FIXED, INCLUDE and EXCLUDE Expressions Running Total and Moving Average Rank and Percentage Calculations
08Filters, Parameters & SetsModule 8 · 1 topics
Dimension and Measure Filters Context and Extract Filters Top N and Conditional Filters Creating and Using Parameters Sets and Combined Sets Dynamic Filters and Parameter Actions
09Dashboard DevelopmentModule 9 · 1 topics
Introduction to Dashboards Creating Interactive Dashboards Dashboard Layout and Formatting Containers and Floating Objects Dashboard Actions and Interactivity Device-Specific Dashboard Layouts Dashboard Performance Optimization
10Advanced Tableau FeaturesModule 10 · 1 topics
Story Points and Storytelling Highlight and URL Actions Interactive Dashboard Navigation Reference Lines and Trend Lines Forecasting and Analytics Features Geographic Analysis and Mapping
11Tableau Server & Tableau CloudModule 11 · 1 topics
Introduction to Tableau Server and Cloud Publishing Workbooks and Data Sources User Roles and Permissions Scheduling Data Extract Refreshes Sharing and Managing Dashboards Understanding Content Management
Creating Business Reports Exporting Dashboards to PDF and Images Data Extract Optimization Dashboard Loading Performance Best Practices for Dashboard Design Data Visualization Standards
13Practical Projects & Career PreparationModule 13 · 1 topics
Real-World Data Analytics Case Studies Interactive Sales Performance Dashboard Financial Performance Analysis Dashboard Customer Insights Dashboard Business KPI Reporting Dashboard Resume Preparation and Interview Guidance Tableau Interview Questions and Practice
Find out how this curriculum fits your career goals.
Tools & technologies
Explore industry-relevant tools through hands-on learning to master practical, in-demand skills.
Tableau Desktop
Tableau Public
Tableau Server
Tableau Cloud
Tableau Prep
Microsoft Excel
SQL / MySQL
CSV and Text Data Sources
Build practical skills with industry-relevant learning, expert guidance, and hands-on projects designed for modern teams.
Get the complete curriculum, tools, projects, and career support details in one brochure.
Build something that matters
6 Industry Projects
Every student completes 6 real-world projects — one per month — building a professional portfolio demonstrated during placement interviews.
Project 01
Sales Performance Analysis Dashboard
Purpose
Develop an interactive Tableau dashboard to analyze sales performance, revenue, profit, and regional sales trends.
Business Output
An interactive Sales Performance Dashboard that helps businesses understand sales trends and identify high-performing products and regions.
Project 02
Customer Insights & Segmentation Dashboard
Purpose
Analyze customer data to understand purchasing behavior, customer segments, and sales contribution
Business Output
A Customer Insights Dashboard that helps businesses understand customer behavior and identify valuable customer segments
Project 03
HR Analytics & Employee Attrition Dashboard
Purpose
Build an HR Analytics Dashboard to analyze employee performance, workforce distribution, and employee attrition.
Business Output
An HR Analytics Dashboard that helps HR teams identify workforce trends and understand employee attrition patterns
Project 04
Financial Performance & Profitability Dashboard
Purpose
Create a comprehensive financial dashboard to analyze revenue, expenses, profit margins, and business performance
Business Output
A Financial Performance Dashboard that provides meaningful insights into business profitability, expenses, and financial trends
Portfolio tip: document the problem, your approach, and the result so you can walk an interviewer through your decisions.
Who should enroll
Analysts building visualization skills
Excel users moving into BI
Business professionals creating reports
Students targeting dashboard roles
Learning modes
Classroom training at Thane center
Live online interactive sessions
Recorded sessions for missed classes
Free demo class before enrollment
Prerequisites
Basic Excel familiarity
SQL knowledge is helpful but not mandatory
Own laptop for dashboard practice
95% of our students successfully get placed after completing our programs.
Learn more about how we have been impacting thousands of careers.
Apply Tableau skills to practical business scenarios
Use Tableau Desktop, Tableau Public, Excel with confidence
Build project work that can be shown in interviews
Prepare for relevant certifications and job roles
Recognition that travels with you
Globally recognized certifications
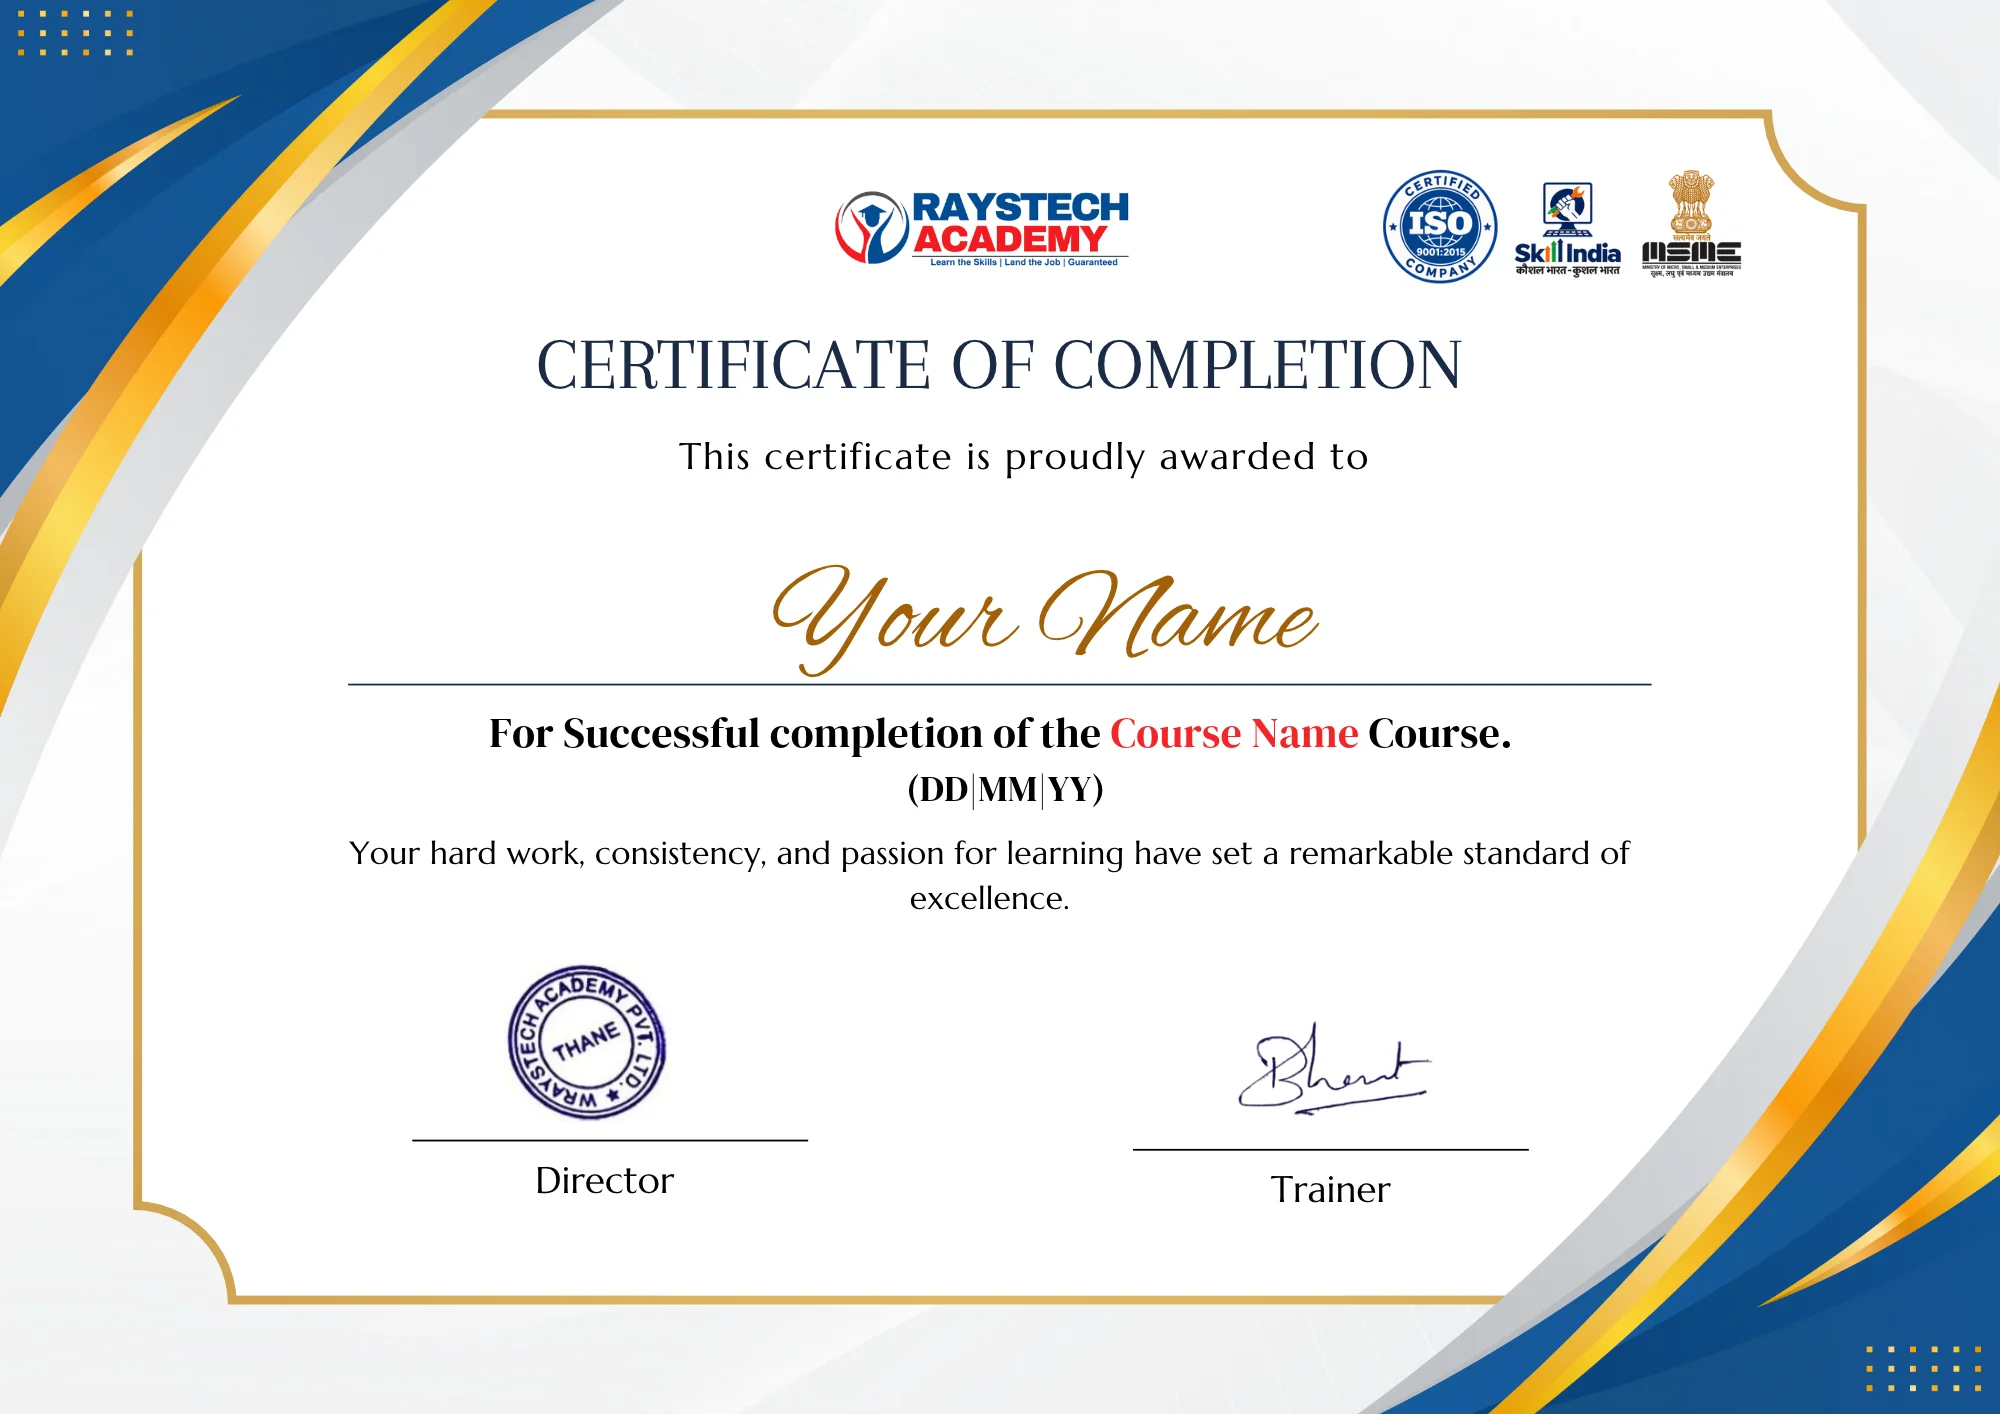
Tableau Certificate
Certification pathway
Stand out with proof of practical skills.
Build a credible portfolio of skills with structured preparation, practical projects, and certification guidance from experienced mentors.
Beyond the classroom
Career Assistance Program
Soft skill session
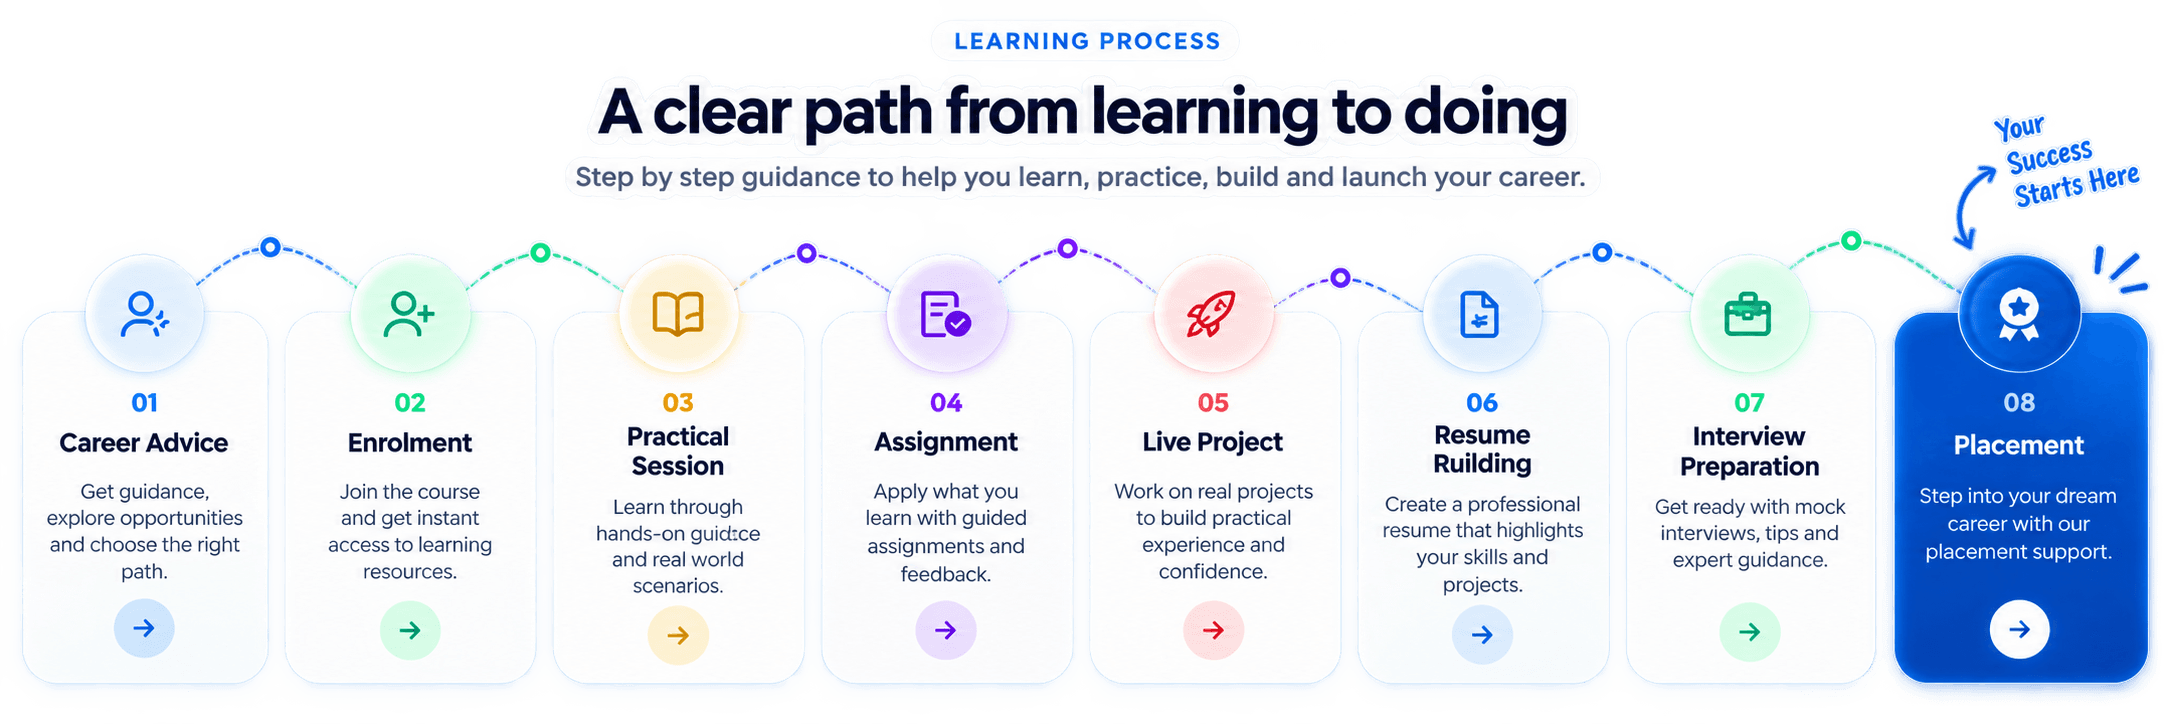
Resume building
Aptitude training
LinkedIn profile building
Mock interview
Job assistance
Placement Assistance
Dedicated placement support with industry connections and recruiter interactions.
Dedicated placement cell with job referrals
Resume & LinkedIn profile optimization
Mock interviews with industry experts
Interview call scheduling support
Career counseling until you get placed
Access your complete learning experience through our all-in-one learning portal.
SkillUpAll-in-one
01Live Mentor Sessions
02AI-Powered Practice
03Progress Tracking
04Career support
One learning hub for your complete career journey
Your next opportunity starts here
Limited seats. High demand. Enroll today.
Industry-ready courseFilling fast
Get industry-ready with Wraystech Academy
Enroll for one course and get access to the complete learning journey
In-depth curriculum with live mentor support
Integrated projects and industry-recognized certifications
Practice on real-world cases and career-ready assignments
Dedicated placement guidance and interview preparation
CAREER OUTCOME
Offer letter preview
Congratulations!
Your practical skills, projects, and career preparation can help you approach interviews with clarity and confidence.
Role-ready preparation
Portfolio, interview practice, and mentor feedback.
Career counsellor
READY
A little more clarity
Frequently asked questions
Answers to common questions about learning, projects, and getting started.
What is Tableau?
Tableau is a powerful data visualization and business intelligence tool used to analyze data and create interactive dashboards, reports, and visual presentations.
Who can join a Tableau Course?
Students, fresh graduates, working professionals, data analysts, business analysts, and anyone interested in data visualization and business intelligence can join this course
Do I need programming knowledge to learn Tableau?
No, programming knowledge is not mandatory to get started. Basic computer knowledge and an understanding of data are helpful for learning Tableau.
What will I learn in the Tableau Course?
You will learn data connections, data preparation, charts, calculated fields, filters, parameters, LOD expressions, interactive dashboards, data storytelling, and Tableau Server fundamentals.
Which tools and technologies are covered in the Tableau Course?
The course covers Tableau Desktop, Tableau Public, Tableau Prep, Tableau Server, Tableau Cloud, Microsoft Excel, and SQL databases.
Is Tableau suitable for beginners?
Yes. Tableau is beginner-friendly, and students can start with basic data visualization before progressing to advanced calculations and interactive dashboard development.
What is the difference between Tableau and Power BI?
Both are popular business intelligence tools. Tableau is widely known for its flexible data visualization and interactive dashboards, while Power BI offers strong integration with Microsoft products and services.
Can non-IT students learn Tableau?
Yes. Students from commerce, science, arts, management, and other non-IT backgrounds can learn Tableau and develop skills for data visualization and reporting roles.
Will I work on practical projects during the Tableau Course?
Yes. Students work on practical assignments and industry-oriented projects, including Sales Performance Analysis, Customer Insights, HR Analytics, and Financial Performance Dashboards.
What types of dashboards can I create using Tableau?
You can create sales dashboards, financial reports, HR analytics dashboards, customer insights dashboards, marketing reports, and business performance dashboards.
What is the difference between Tableau Desktop and Tableau Public?
Tableau Desktop is a professional authoring tool used to connect, analyze, and visualize data. Tableau Public is a free platform for creating and publicly sharing visualizations, where published workbooks and data may be accessible to others.
What career opportunities are available after learning Tableau?
You can explore career opportunities such as Tableau Developer, Data Analyst, Business Intelligence Analyst, Reporting Analyst, and Data Visualization Specialist, depending on your overall skills and experience.
Is SQL knowledge required for Tableau?
SQL is not compulsory for basic Tableau usage, but knowledge of SQL helps you connect to databases, retrieve data, and perform more advanced data analysis.
Can Tableau handle large datasets?
Yes. Tableau can work with large datasets using live connections and extracts. Performance depends on data size, source system, connection type, and dashboard design.
Does Raystech Academy provide placement assistance after the Tableau Course?
Raystech Academy provides career guidance and placement assistance, which may include resume preparation, mock interviews, and support in exploring relevant job opportunities.
Your next chapter starts with a conversation.
Discuss your background, explore the course, and get help choosing a learning plan that fits your goals.