By continuing, you agree to our Terms and Privacy Policy. We'll send important updates on WhatsApp.
35,000+ learners already enrolled
Your next step
Program overview
Data Analytics with GenAI is a 6-month, hands-on program designed to build job-ready skills in Excel, SQL, Power BI, Tableau, Python and GenAI. Learn through practical assignments, real-world business scenarios, and portfolio projects, with interview preparation and placement support to help you prepare for roles like Data Analyst and BI Analyst.
Hands-on practice with Excel, SQL, Power BI, Tableau, and Python
Business Intelligence foundations with Advanced Excel and MIS dashboard design
Six portfolio-ready industry projects with guided labs and capstone presentation
Resume building, mock interviews, interview preparation, and job placement support
A structured learning journey
Data Analytics with GenAI Curriculum
Explore the curriculum, build your understanding one module at a time, and put each new skill into practice.
What is Business Intelligence? — Data vs Information vs Insight vs Decision; what BI is and why businesses need it; Data Analyst vs Business Analyst vs BI Analyst roles; the BI ecosystem from data sources through ETL and data warehouses to reports/dashboards; descriptive, diagnostic, predictive, and prescriptive analytics; MIS reports vs dashboards
KPIs & Business Metrics Fundamentals — What makes a good KPI; Revenue, Growth %, Churn, Conversion Rate, and AOV; departmental KPIs for Sales, Finance, HR, Operations, and Marketing; reading a business dashboard like a manager
Excel Essentials — Excel UI, ribbons, workbook and sheet management; data types, cell formats, sorting and filtering; named ranges; data validation and drop-down lists; conditional formatting and custom rules
Analytical Formulas — SUM, COUNT, AVERAGE, MIN, MAX, IFS; VLOOKUP, HLOOKUP, INDEX-MATCH, XLOOKUP; IFERROR, ISNUMBER, TEXT, DATE; array formulas and dynamic arrays including FILTER, UNIQUE, and SORT
Data Cleaning in Excel — Remove duplicates; find and replace; TRIM/CLEAN; Text-to-Columns; Flash Fill; handling nulls, blanks, and inconsistencies; data auditing tools including trace precedents and dependents
PivotTables, Charts & Power Query — PivotTable rows, columns, values, and filters; calculated fields and items; slicers, timelines, and drill-down; bar, line, combo, waterfall, funnel, and sparkline charts; CSV, Excel, and SQL connections; applied steps; merge and append; M basics
MIS Dashboard Design — Dashboard layout principles and UX for business users; interactive dashboards with slicers; Record Macro automation basics; BI storytelling for management; protecting sheets and workbooks; print and sharing settings
Database & BI Data Modelling Fundamentals — RDBMS tables, keys, and relationships; how BI systems store data using fact and dimension tables; SQL Server vs MySQL vs PostgreSQL; SSMS and Object Explorer; creating databases, schemas, and tables; SQL data types; CREATE, ALTER, DROP, and TRUNCATE
Core SQL for Business Reporting — SELECT, FROM, WHERE, ORDER BY, and DISTINCT; filtering with BETWEEN, IN, LIKE, and IS NULL; CASE WHEN expressions for business logic; INSERT, UPDATE, and DELETE statements
Aggregation & Business Metrics — GROUP BY and HAVING; SUM, COUNT, AVG, MIN, and MAX for KPIs; COUNT(DISTINCT); COUNTIF-style logic; ROLLUP and CUBE grouping sets
Joins & Relationships — INNER, LEFT, RIGHT, and FULL JOIN; CROSS JOIN and SELF JOIN; multi-table joins with aliases for business reports; NULL behaviour in joins
Subqueries, CTEs & Advanced SQL — Scalar, correlated, and table-valued subqueries; IN, EXISTS, and NOT EXISTS; WITH/Common Table Expressions; UNION, UNION ALL, INTERSECT, and EXCEPT; ROW_NUMBER, RANK, DENSE_RANK, LAG, and LEAD; stored procedures and views for reusable BI reporting
03Module - 03 | Power BI & Tableau for Business IntelligenceWeeks 9–12 · 20 sessions · 40 hours · 9 topics
Power BI Foundations — Power BI Desktop, Service, Mobile, and Gateway; Import vs DirectQuery vs Composite; connecting Excel, SQL Server, CSV, Web, and JSON; data source settings and privacy levels
Power Query — Query Editor interface and applied steps; data profiling with column quality and distribution; nulls, errors, replacements, and data types; pivot, unpivot, transpose, merge, and append
Data Modelling for BI — Star and snowflake design; fact and dimension tables; grain and keys; relationships, cardinality, and cross-filter direction; role-playing dimensions and date table creation
DAX for Business Metrics — Measures vs Calculated Columns; row vs filter evaluation context; SUM, COUNT, CALCULATE, FILTER, and ALL; YTD, MTD, QTD, and YoY; SUMX, RANKX, TOPN, and VAR/RETURN variables
Visualization, Storytelling & Publishing — Visual selection, formatting, themes, slicers, and sync slicers; drill-down, drill-through, bookmarks, and tooltips; Key Influencers, Anomaly Detection, and Forecasting; workspaces, apps, publishing, scheduled refresh, RLS; PL-300 exam strategy and mock test
Tableau Public Foundations — Tableau Public vs Tableau Desktop vs Tableau Server; Data Source pane, Sheets, Dashboards, and Stories; Excel, CSV, and Google Sheets connections; live connections vs extracts; dimensions vs measures; data types; joins and unions
Tableau Visual Analytics — Bar, line, map, scatter, and dual-axis charts; calculated fields and table calculations; filters, parameters, sets, and groups; formatting business-ready visuals for non-technical audiences
Tableau Dashboards & Storytelling — Dashboard layout, actions, and interactivity; stories for presenting insights to stakeholders; publishing and sharing visualizations on Tableau Public
Tableau vs Power BI — Choosing the right tool for the job
04Module - 04 | Python for Data Analysis & BIWeeks 13–16 · 20 sessions · 40 hours · 5 topics
Python Foundations — Python installation with VS Code and Jupyter Notebook; variables, data types, operators, and conditions; for and while loops; list and dictionary comprehensions; functions, lambda, *args, **kwargs, and error handling
NumPy for Numerical Computing — Arrays, ndarray, shape, reshape, and dtype; indexing, slicing, and broadcasting; mean, median, standard deviation, and percentile calculations
Pandas for Business Data Analysis — Series and DataFrame creation and import/export; reading CSV, Excel, SQL, and JSON; filtering, sorting, groupby, and aggregation as the Python equivalent of PivotTables; merging, joining, and concatenating; missing values, duplicates, and outliers
Data Cleaning, EDA & Visualization — Exploratory Data Analysis workflow; IQR and Z-score outlier detection; correlation matrices and heatmaps; feature engineering basics; Matplotlib, Seaborn, and Plotly for business-ready charts
Python + BI Integration — Python scripts inside Power BI Desktop; report automation with Python; requests library and REST API consumption; exporting insights to Excel and Power BI
05Module - 05 | Generative AI for Business ProfessionalsWeeks 17–20 · 20 sessions · 40 hours · 5 topics
Generative AI Fundamentals — AI, ML, DL, and GenAI in business language; neural networks and transformer architecture conceptually; text, image, code, and audio models; GPT, Gemini, and Claude overview; bias, hallucination, privacy concerns, and ethical AI
Large Language Models — Pre-training, fine-tuning, and RLHF overview; tokens, context window, and temperature; GPT-4o, Gemini, Claude, and Mistral comparison; limitations and responsible use; Retrieval-Augmented Generation concept
Prompt Engineering — Zero-shot, one-shot, and few-shot prompting; chain-of-thought, role prompting, and persona assignment; instruction tuning and output formatting; iterative refinement; prompt templates and reusable frameworks
AI Tools for Business Productivity — ChatGPT advanced features and Custom GPTs; Google Gemini Workspace integration; Microsoft Copilot for M365 and Bing; Claude document analysis and reasoning; Perplexity AI, NotebookLM, Gamma AI, and Canva AI
Practical AI Workflows for Analysts — AI-assisted emails, reports, and proposals; research, summarisation, and translation; multi-step prompting; data interpretation and storytelling; evaluating AI output quality and fact-checking
AI-Assisted Data Analytics & BI — ChatGPT and Copilot for data exploration; AI-generated SQL queries and query explanation; natural language to SQL; AI suggestions for data cleaning and anomaly flagging; Power BI Copilot Q&A and Smart Narrative; AI formula generation in Excel
Python + GenAI Integration — OpenAI Python SDK and calling GPT-4o via API; automating data insights with LLM-generated summaries; LangChain chains, prompts, and memory; simple document-based RAG pipeline; structured output parsing with JSON mode
AI Automation & Agents — What AI agents are and an overview of agent frameworks; task decomposition and multi-step agent logic; data research and reporting agents; simple analytics chatbot prototype
AI-Powered BI Reporting & Industry Use Cases — AI-generated executive summaries from dashboards; Smart Narrative in Power BI; AI-driven anomaly detection; natural-language Q&A dashboard design; retail forecasting, finance risk, HR attrition, healthcare NLP, and marketing segmentation
Capstone, Career & Certification — Full BI, Data Analytics, and AI solution; GitHub, LinkedIn, and resume preparation; technical and HR mock interviews; MIS Executive → Data/BI Analyst → AI Analyst career pathway; Microsoft PL-300, Google, and OpenAI certification landscape
Find out how this curriculum fits your career goals.
Tools & technologies
Explore industry-relevant tools through hands-on learning to master practical, in-demand skills.
Excel
SQL
Power BI
Tableau
Python
NumPy
Matplotlib
Pandas
SciPy
Build practical skills with industry-relevant learning, expert guidance, and hands-on projects designed for modern teams.
Get the complete curriculum, tools, projects, and career support details in one brochure.
Build something that matters
6 Industry Projects
Every student completes 6 real-world projects — one per month — building a professional portfolio demonstrated during placement interviews.
Project 01
AI-Powered Sales & Revenue Intelligence
Purpose
Analyse sales transactions, customer behaviour, product performance, regional sales, revenue, and profitability trends. GenAI converts analytical findings into management-friendly insights.
Business Output
A clear view of revenue drivers, profitable products, high-performing regions, and performance gaps to support sales growth, better product mix, and corrective action.
Project 02
Customer Churn & Retention Analytics
Purpose
Analyse customer transactions, engagement, usage patterns, complaints, and customer characteristics to identify factors influencing churn. Use analytics and predictive techniques to identify customers at risk of leaving.
Business Output
Identify high-risk and high-value customers before they leave, enabling targeted retention campaigns, personalised offers, and proactive engagement to reduce churn and improve customer lifetime value.
Project 03
AI-Powered Supply Chain & Inventory Analytics
Purpose
Analyse inventory levels, product demand, stock movement, supplier performance, lead times, and stock-out patterns to identify inventory risks and supply-chain inefficiencies.
Business Output
Identify slow-moving products, excess inventory, stock-out risks, and supplier performance issues to optimise inventory, reduce carrying costs, improve product availability, and minimise disruptions.
Project 04
Employee Attrition & Workforce Analytics
Purpose
Analyse employee information including department, tenure, salary, performance, job role, and workforce factors to understand attrition patterns and identify the major factors associated with employee turnover.
Business Output
Help HR teams identify attrition-prone departments, employee segments, and retention risks to reduce hiring costs and improve workforce stability.
Analyse revenue, expenses, costs, margins, budgets, and profitability across products, departments, regions, or business units to understand financial performance and profit-and-loss drivers.
Business Output
Reveal profitability drivers, cost leakage, budget variances, and margin improvement opportunities for better cost control, financial planning, and strategic decisions.
Project 06
Healthcare Operations & Patient Analytics
Purpose
Analyse patient visits, appointments, waiting times, hospital departments, bed occupancy, resource utilisation, and operational performance to identify bottlenecks and improve healthcare-service efficiency.
Business Output
Identify high-demand departments, resource-utilisation gaps, waiting-time problems, and operational inefficiencies to improve patient experience and support better planning.
Portfolio tip: document the problem, your approach, and the result so you can walk an interviewer through your decisions.
95% of our students successfully get placed after completing our programs.
Learn more about how we have been impacting thousands of careers.
Recognition that travels with you
Globally recognized certifications
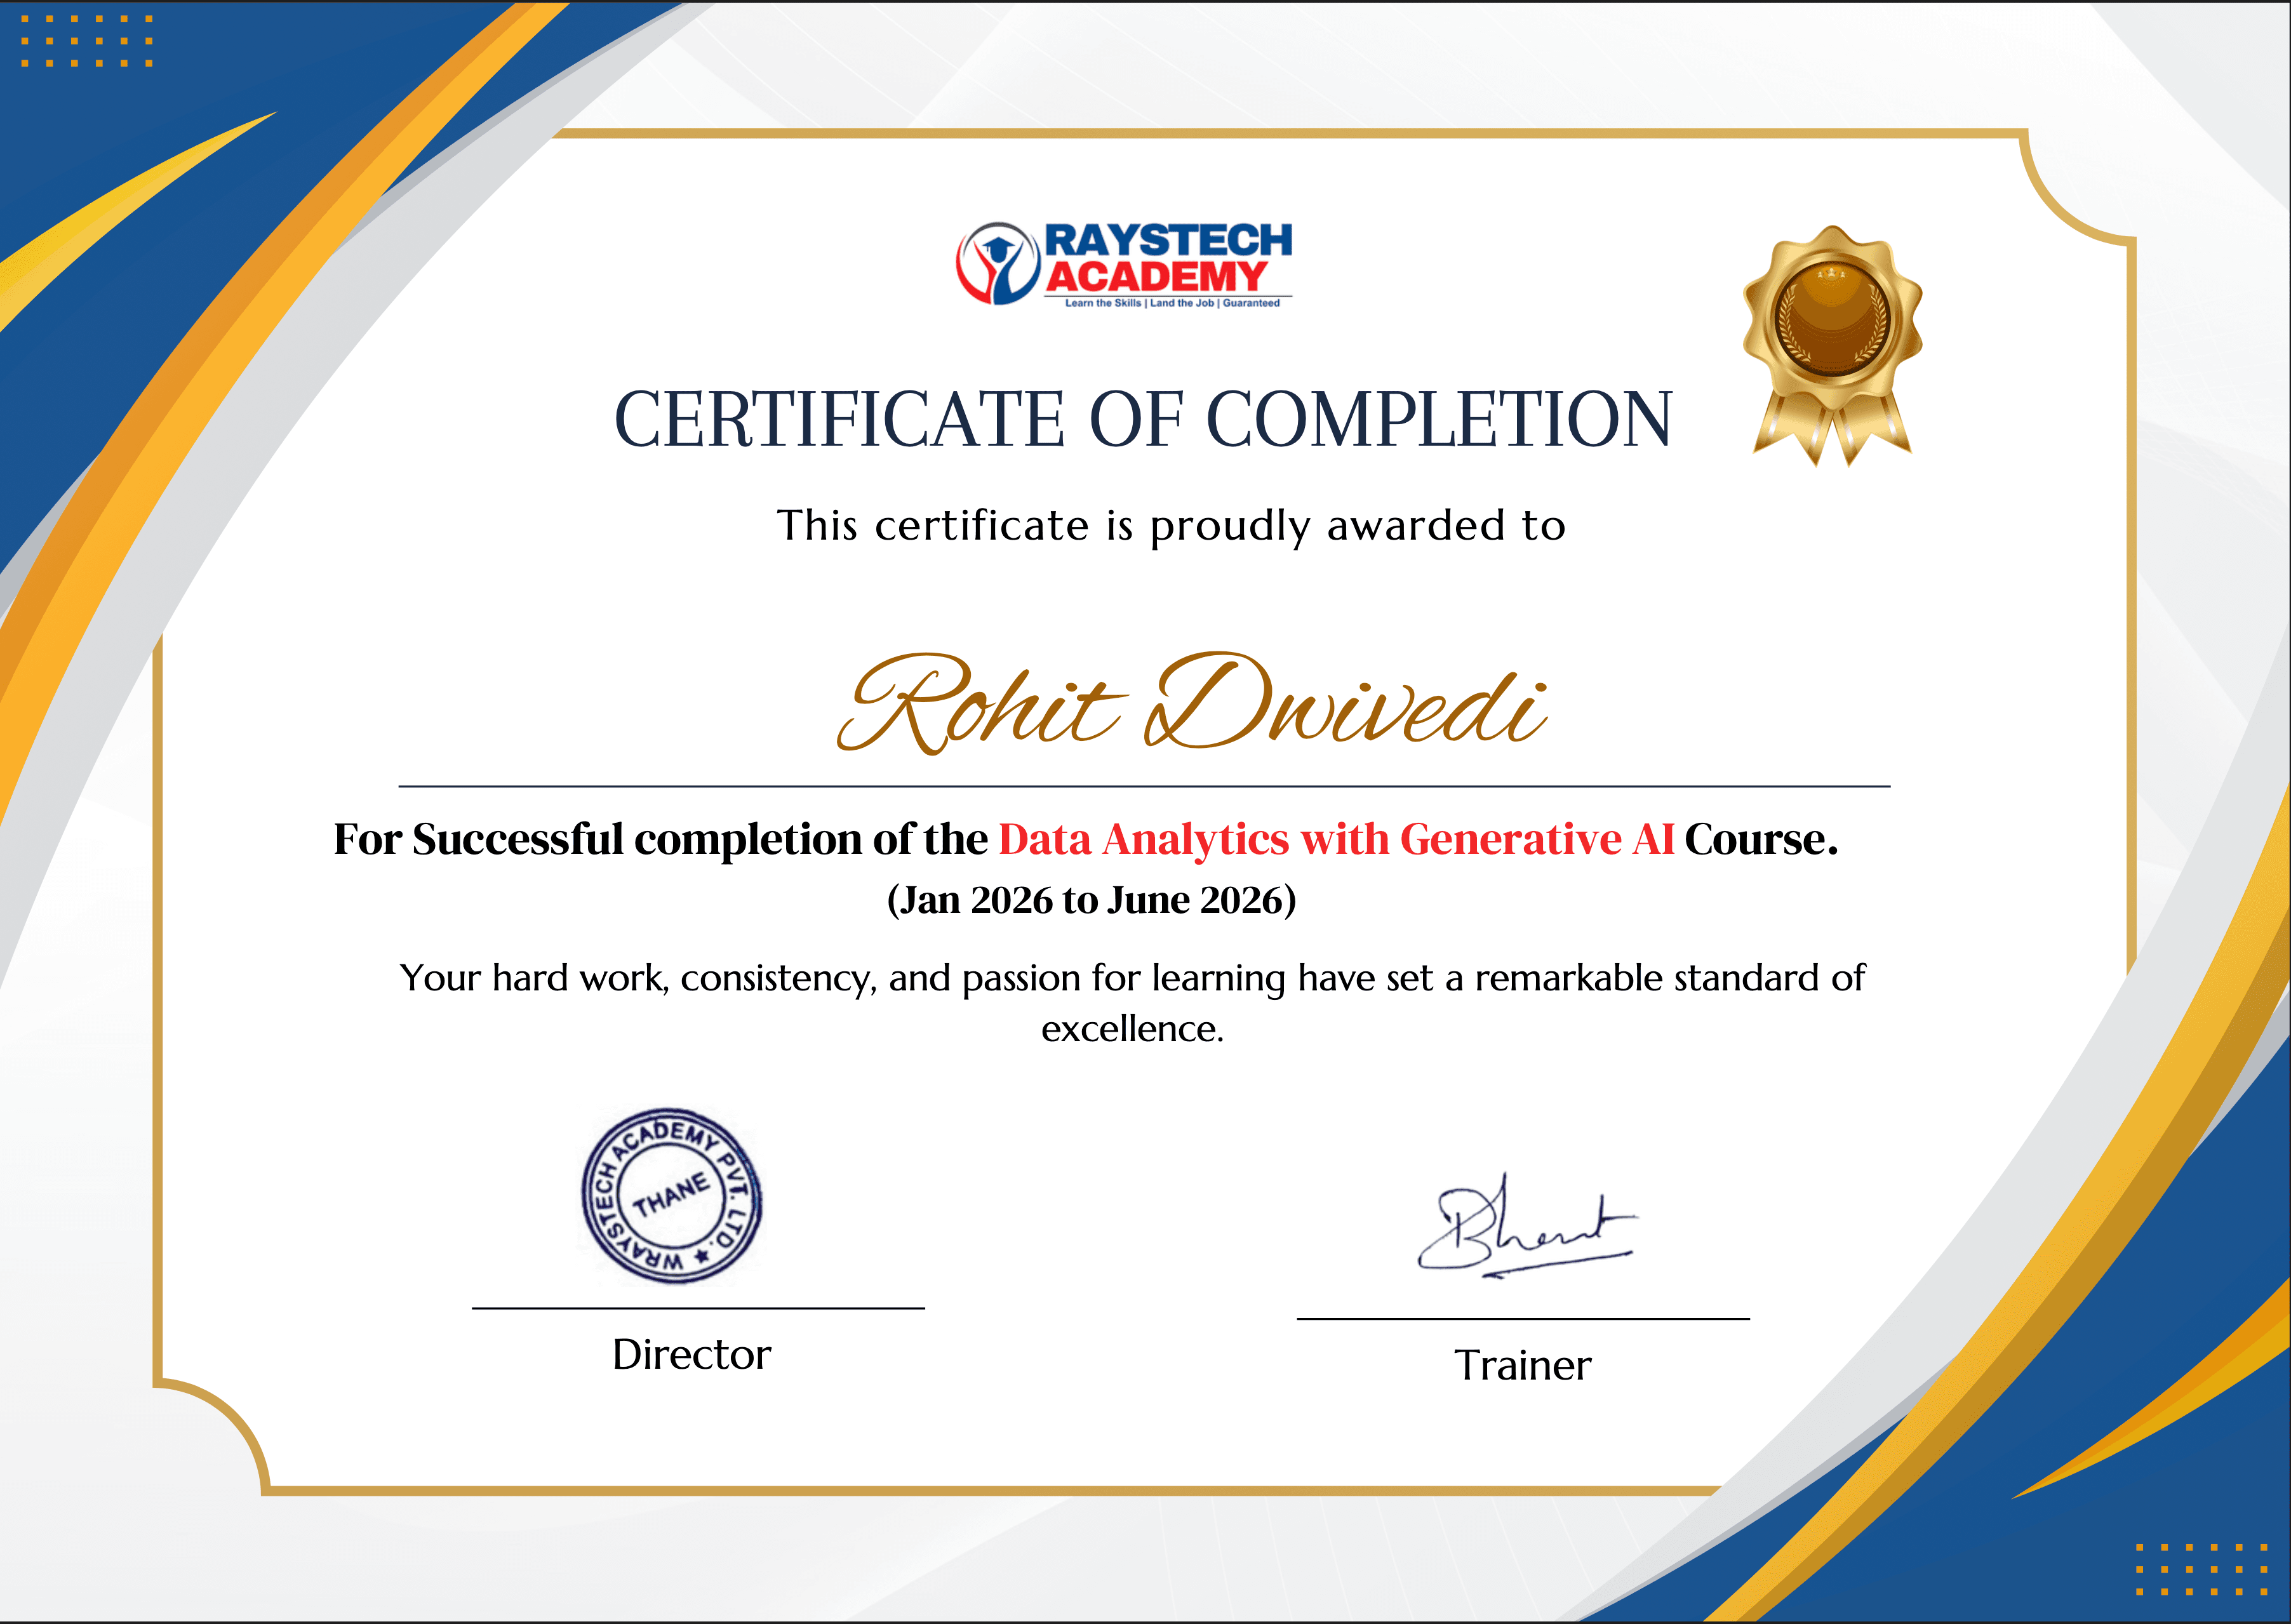
RaysTech Academy certificate
Certification pathway
Stand out with proof of practical skills.
Prepare for the Microsoft PL-300 pathway with Power BI practice, mock exam strategy, portfolio development, resume and LinkedIn preparation, and technical and HR mock interviews.
Beyond the classroom
Career & Placement Support
Soft skill session
Resume building
Aptitude training
LinkedIn profile building
Mock interview
Job assistance
Career & Placement Assistance
Get comprehensive support to help you become job-ready and confident for your career in Data Analytics.
Career guidance and personalized counseling
Resume building and LinkedIn profile support
Interview preparation and mock interviews
Portfolio and project guidance
Job search and application assistance
Access to video lessons from multiple trainers
Student voices
Success Stories
Hear how learners turned structured practice into career momentum.
4.8 learner rating
VV
Veera Venkata
Data Analyst
4.8
“The hands-on projects helped me build confidence and a portfolio I could explain clearly in interviews.”
SS
Sakshi Singaraddi
Trainee Software Engineer
4.8
“The mentors made every step approachable and the career guidance helped me prepare with direction.”
VV
Veera Venkata
Data Analyst
4.8
“The hands-on projects helped me build confidence and a portfolio I could explain clearly in interviews.”
SS
Sakshi Singaraddi
Trainee Software Engineer
4.8
“The mentors made every step approachable and the career guidance helped me prepare with direction.”
Access your complete learning experience through our all-in-one learning portal.
SkillUpAll-in-one
01Live Mentor Sessions
02AI-Powered Practice
03Progress Tracking
04Career support
One learning hub for your complete career journey
Your next opportunity starts here
Limited seats. High demand. Enroll today.
Industry-ready courseFilling fast
Get industry-ready with Wraystech Academy
Industry-Relevant Curriculum with hands-on learning
Live Mentor Support for guidance and doubt resolution
Practical Projects & Case Studies to strengthen your portfolio
Real-World Assignments to build problem-solving skills
Interview & Career Preparation to help you confidently pursue analytics roles
Start your Data Analytics journey with RaysTech Academy.
Your next opportunity starts here
Get a 3-Month Internship with a 100% Internship Guarantee
A little more clarity
Frequently Asked Questions — Data Analytics with GenAI
Answers to common questions about learning, projects, and getting started.
What is the Data Analytics with GenAI program?
It is a comprehensive program designed to help you develop practical skills in Excel, SQL, Power BI, Data Analytics, and Generative AI through hands-on learning and projects.
How long is the program?
The program duration is 6 months, including guided learning, practical assignments, projects, and career preparation.
Who can join this program?
The program is suitable for students, graduates, working professionals, and beginners who want to build a career in Data Analytics.
Do I need prior experience in Data Analytics?
No. The program starts with the fundamentals, making it suitable for beginners as well as learners with basic knowledge.
What tools and technologies will I learn?
You will learn key analytics tools and technologies including Excel, SQL, Power BI, and GenAI.
Is the program hands-on?
Yes. The program focuses on practical exercises, assignments, projects, and real-world business scenarios to strengthen your analytical skills.
Will I work on real-world projects?
Yes. You will work on practical projects and case studies that can help demonstrate your skills through a professional portfolio.
Will I receive a certificate after completing the program?
Yes. Upon meeting the program requirements, you will receive a RaysTech Academy certificate.
Is an internship included in the program?
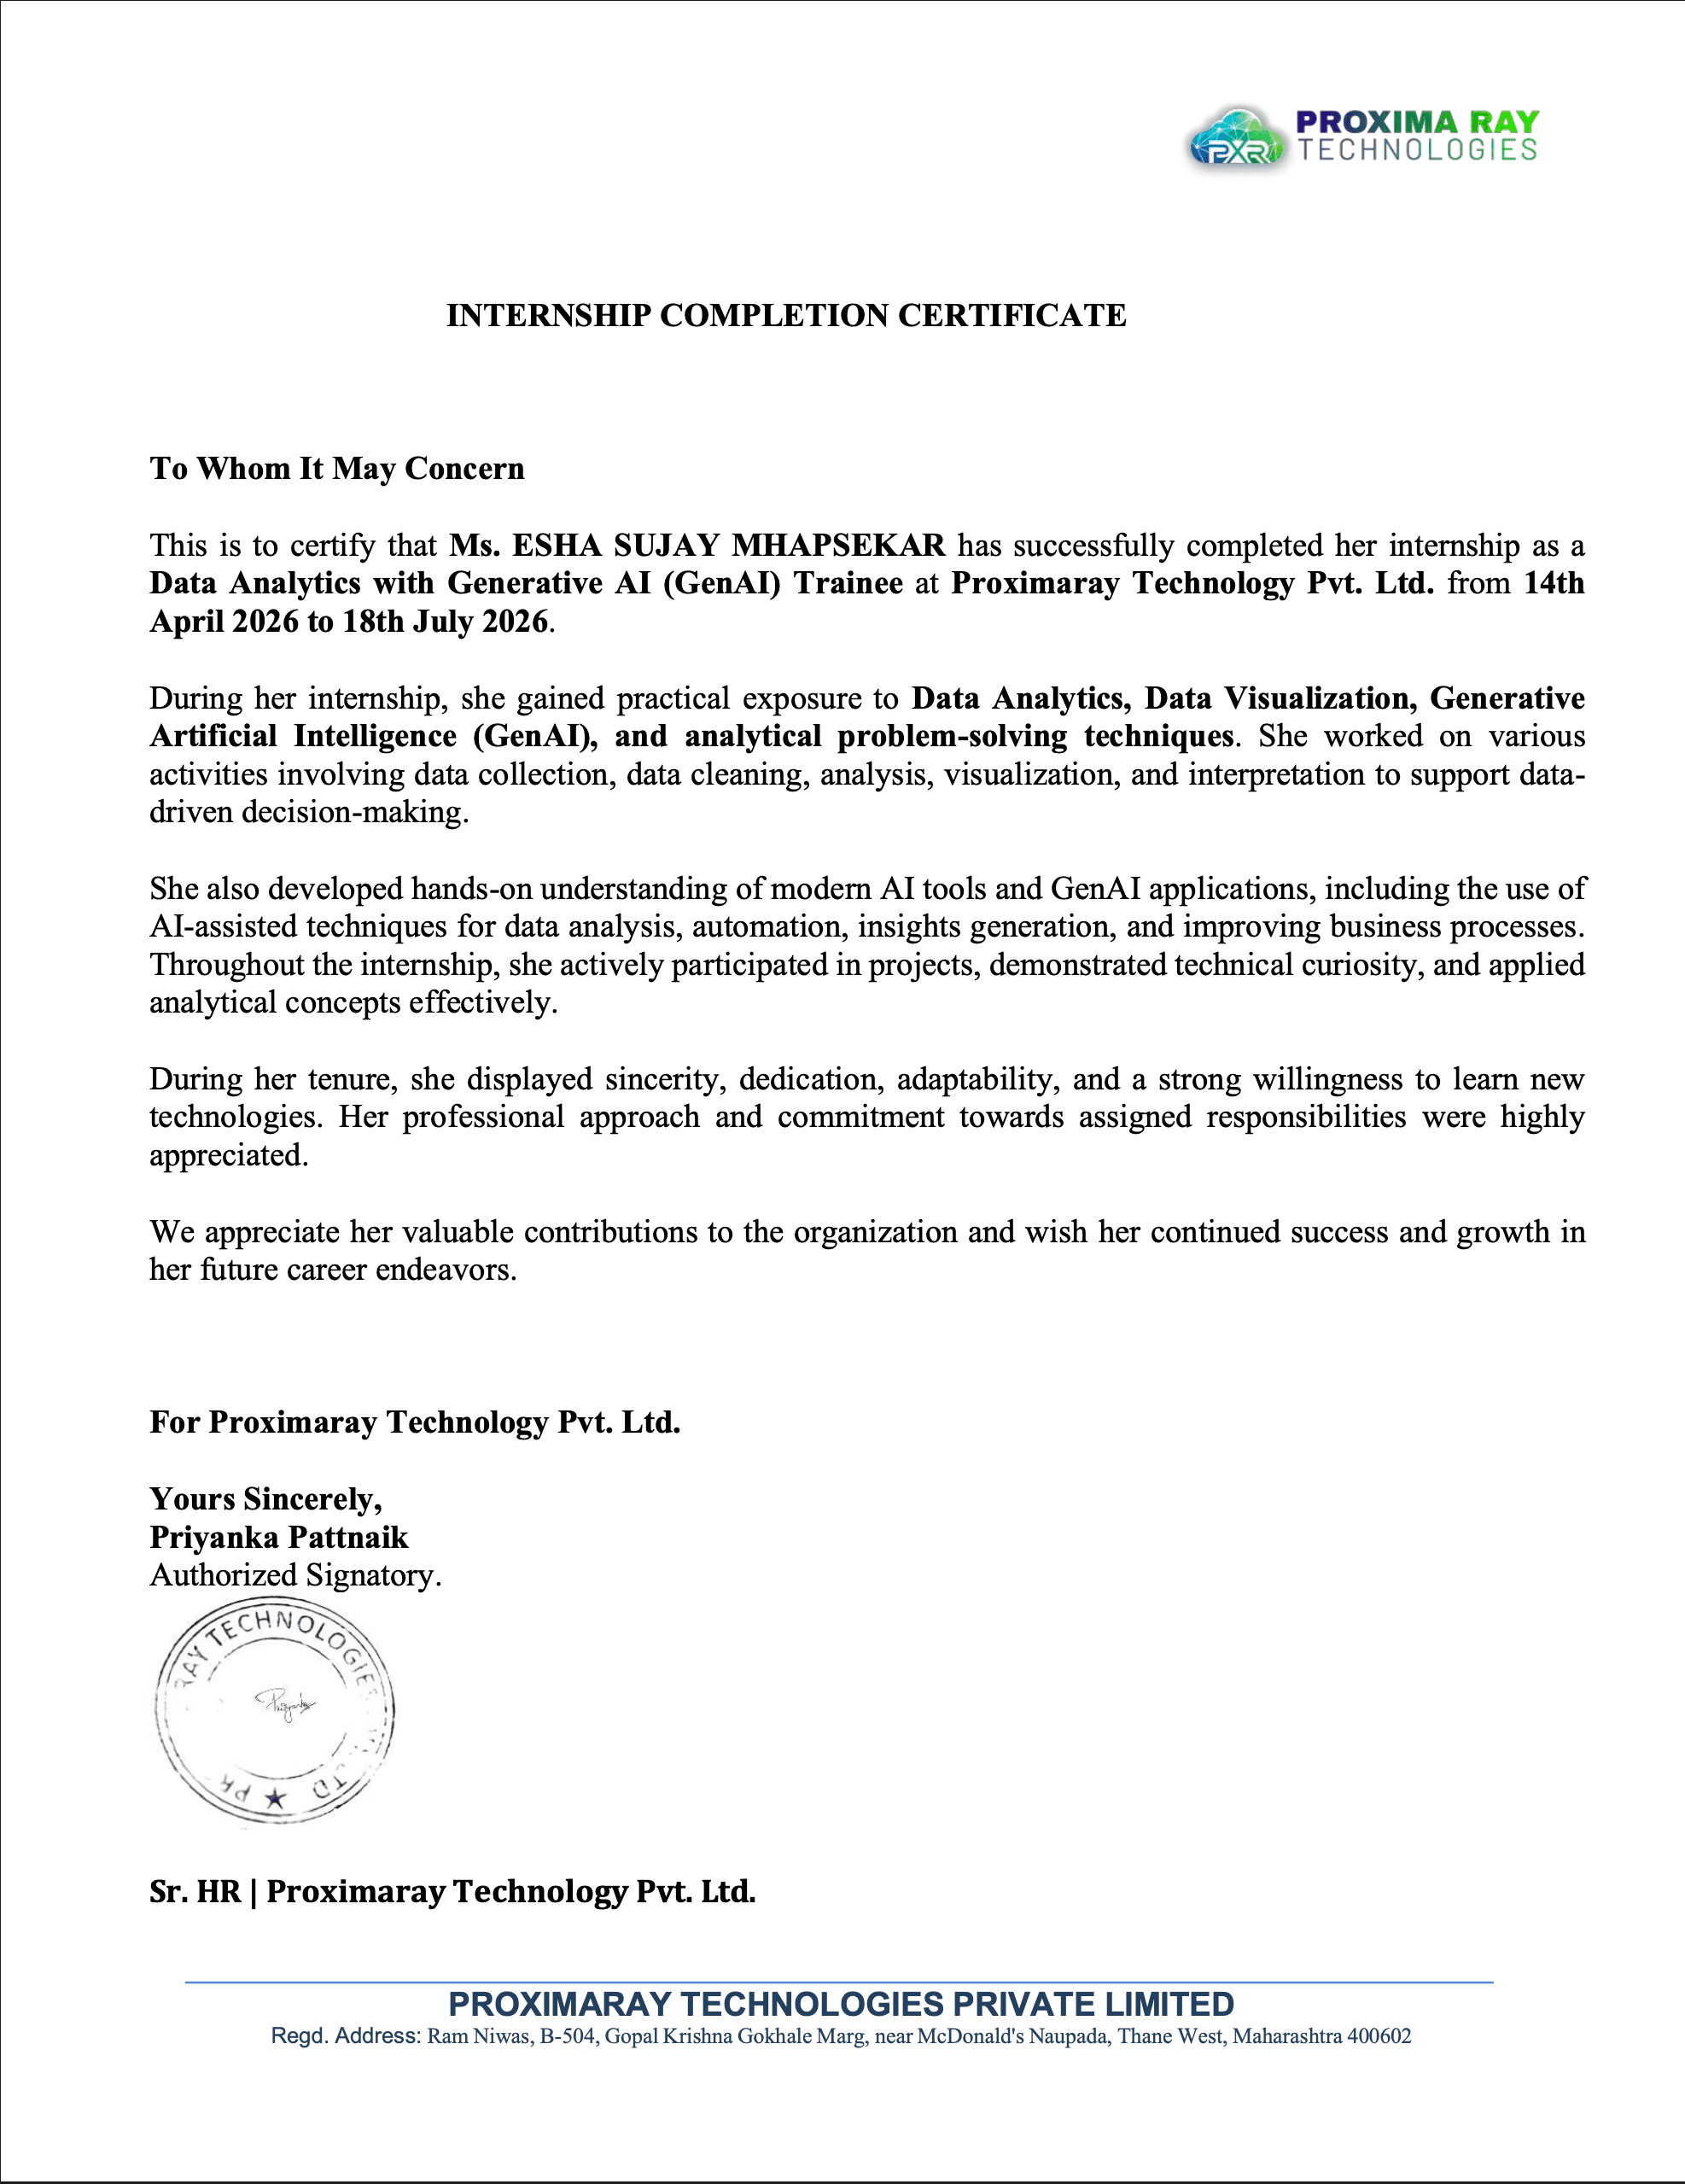
If included in your selected program, you will receive an opportunity to gain practical internship experience along with an internship certificate.
Will I get interview preparation?
Yes. The program includes interview preparation, mock interviews, and guidance to help you prepare for Data Analytics roles.
Do you provide placement assistance?
Yes. We provide career guidance, resume support, interview preparation, and assistance with relevant job opportunities.
Will I get help with my resume and LinkedIn profile?
Yes. You will receive guidance on resume building and LinkedIn profile optimization to improve your professional profile.
What career opportunities can I pursue after the program?
You can explore roles such as Data Analyst, Junior Data Analyst, Business Intelligence Analyst, and Reporting Analyst, depending on your skills and experience.
How are the sessions conducted?
The program includes guided learning and mentor support, with practical sessions designed to help you understand and apply the concepts.
How can I enroll in the program?
You can contact RaysTech Academy for enrollment details, batch schedules, fees, and the next available start date.
Your next chapter starts with a conversation.
Discuss your background, explore the course, and get help choosing a learning plan that fits your goals.
Six-month Data Science program covering Python, statistics, Machine Learning, Deep Learning, NLP, and Generative AI, with 20 sessions and 40 hours of training each month.